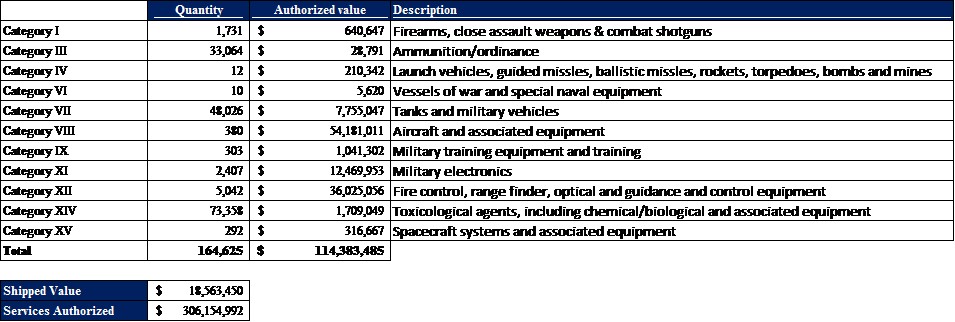
Updated on Monday (12/17) morning, below are 8 slides covering (click on any slide for larger version):
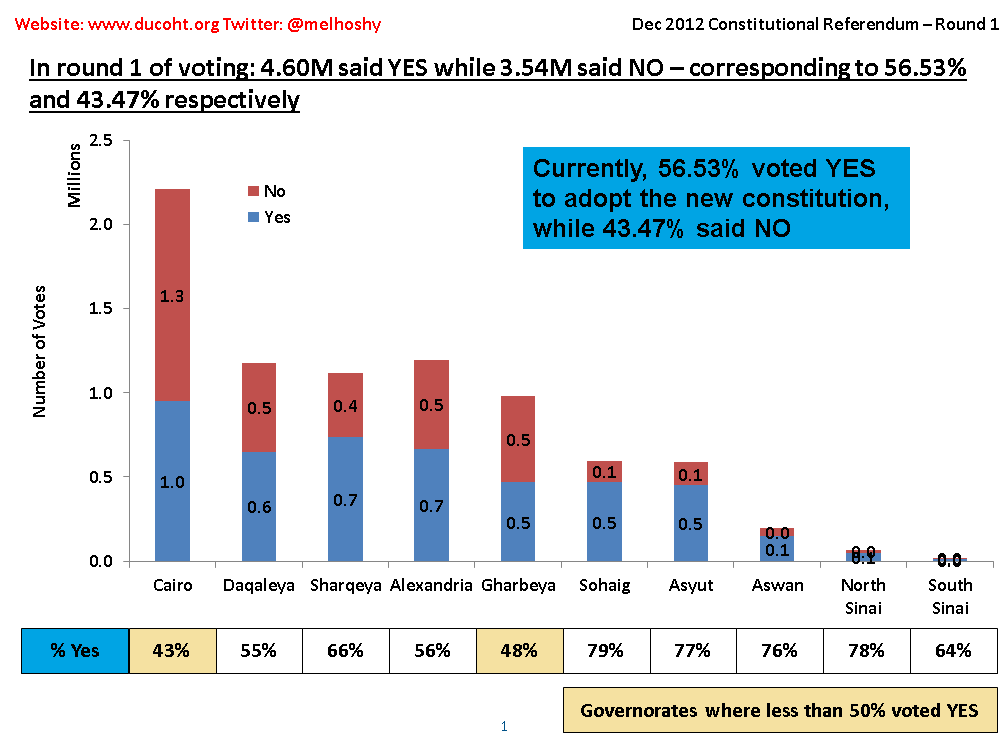
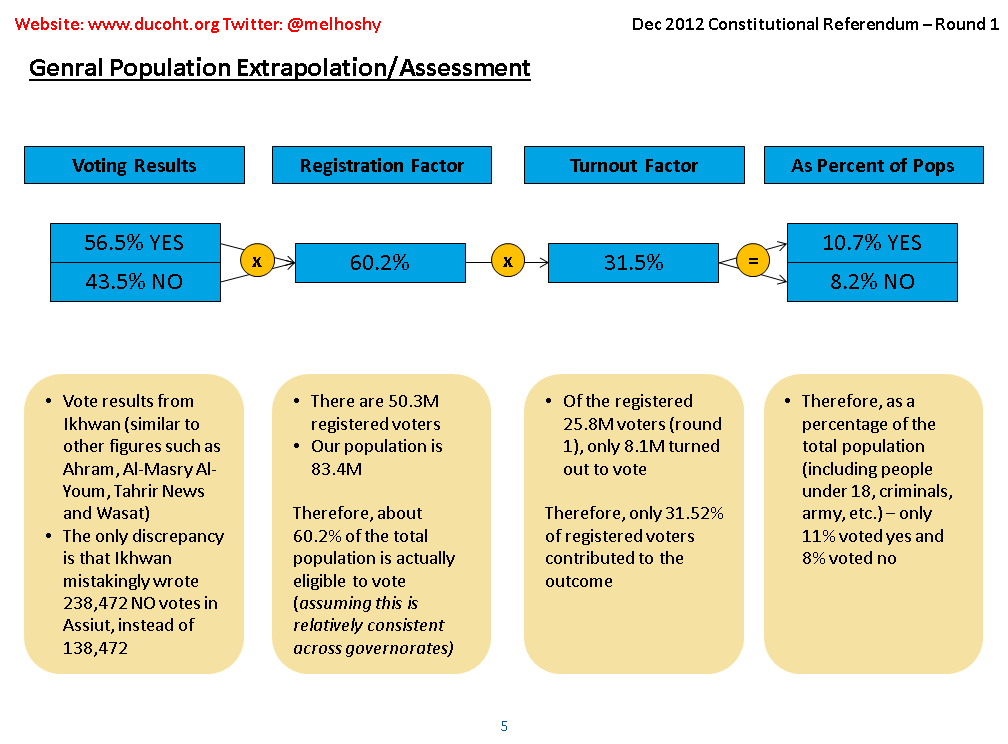
1. Voting results: 57% said YES in Round 1
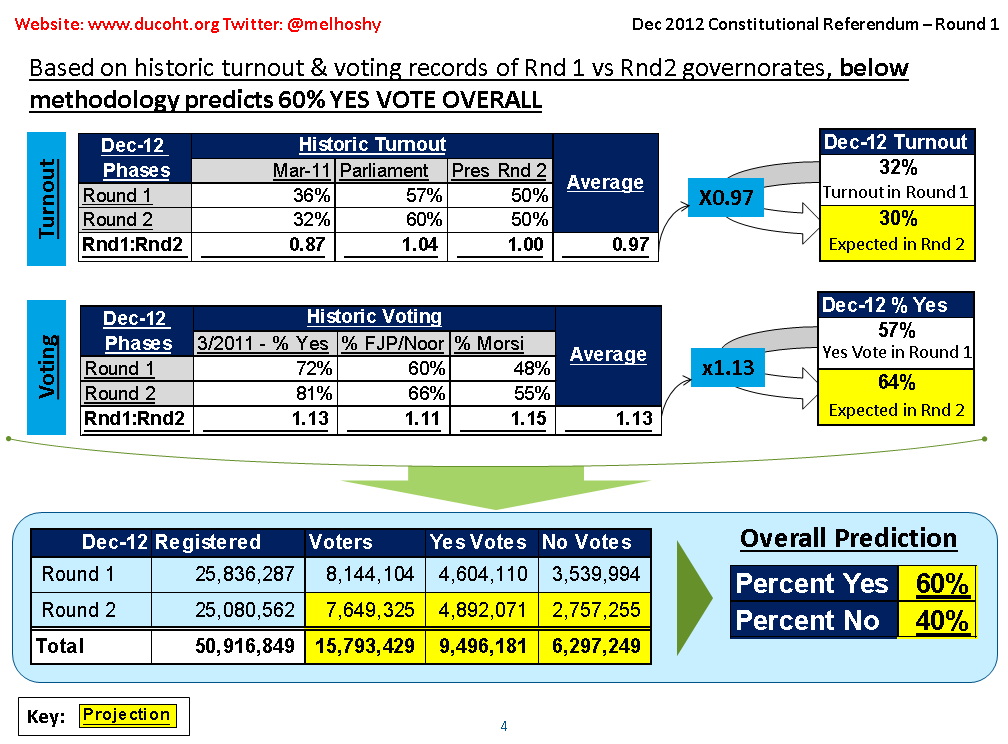
2. Projections for Round 2: Expected 30% turnout with 64% YES vote - yielding overall result, across both rounds, at 60% YES
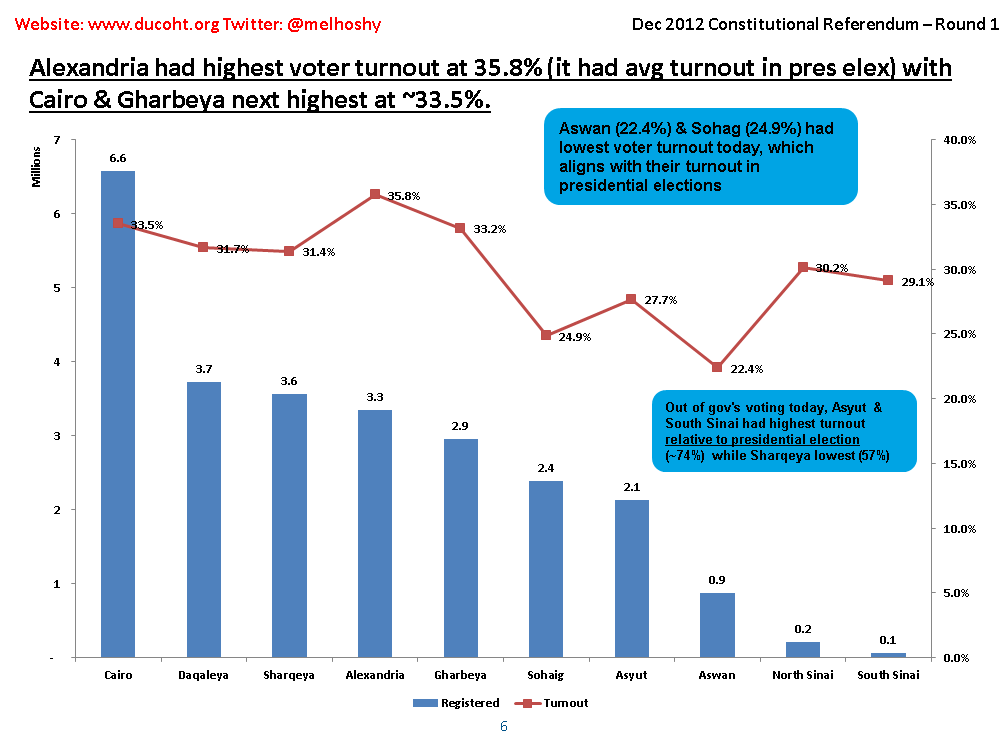
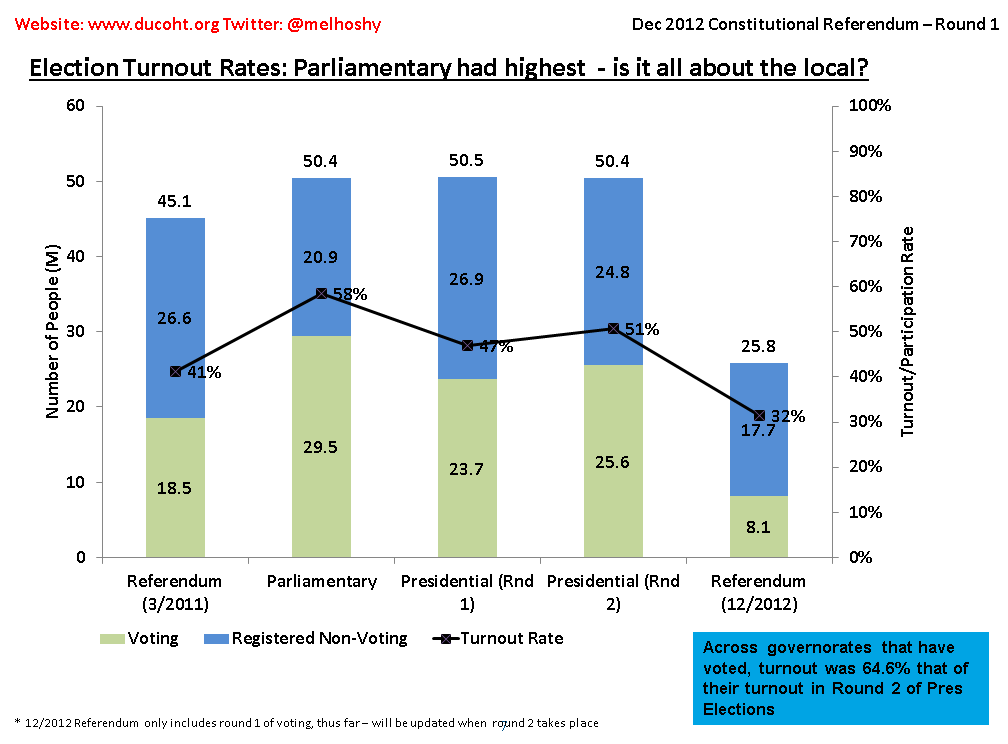
3. Participation Rates: 32% in Round 1 - pretty low
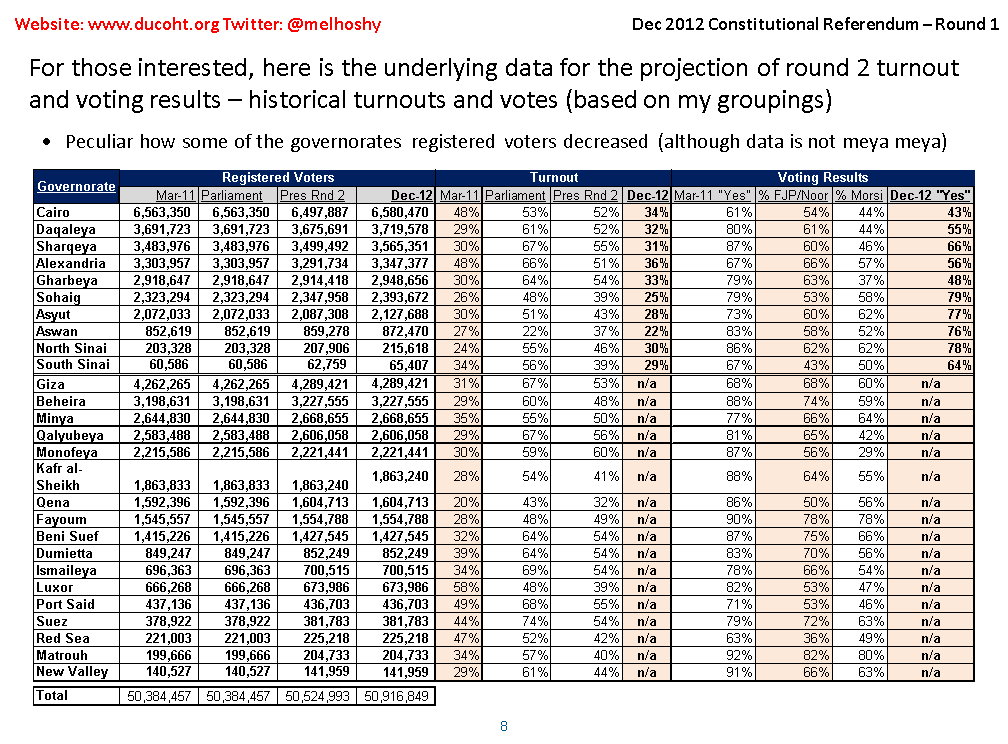
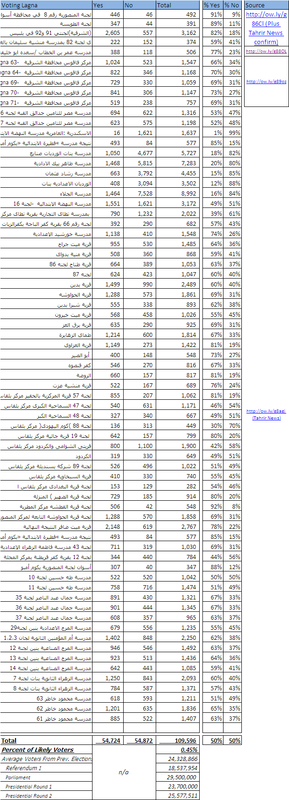
4. Detailed/underlying data (any corrections welcome)
1. Voting Results
2. Projections for Round 2 (and more detailed results)
It really does not entail much more than taking data and extrapolating it so take it at face value but it is interesting in either of two cases:
1. If it is right: Then we are starting to see some voting trends across governorates and parties can begin to capitalize on this and target campaigns. Or, I just got lucky and it was some other factors/data/variables.
2. If it is wrong: Then we see deviations in Egypt's voting across the elections and it illustrates changing tendencies and fluid loyalties. Or, my methodology/analysis was flawed.
The biggest caveat of all the analysis on this website (thus far at least) is that it is based on governorates level data and results. For example, in Cairo there are 43 marakiz which would allow for a much more granular analysis.
3. Participation Rates
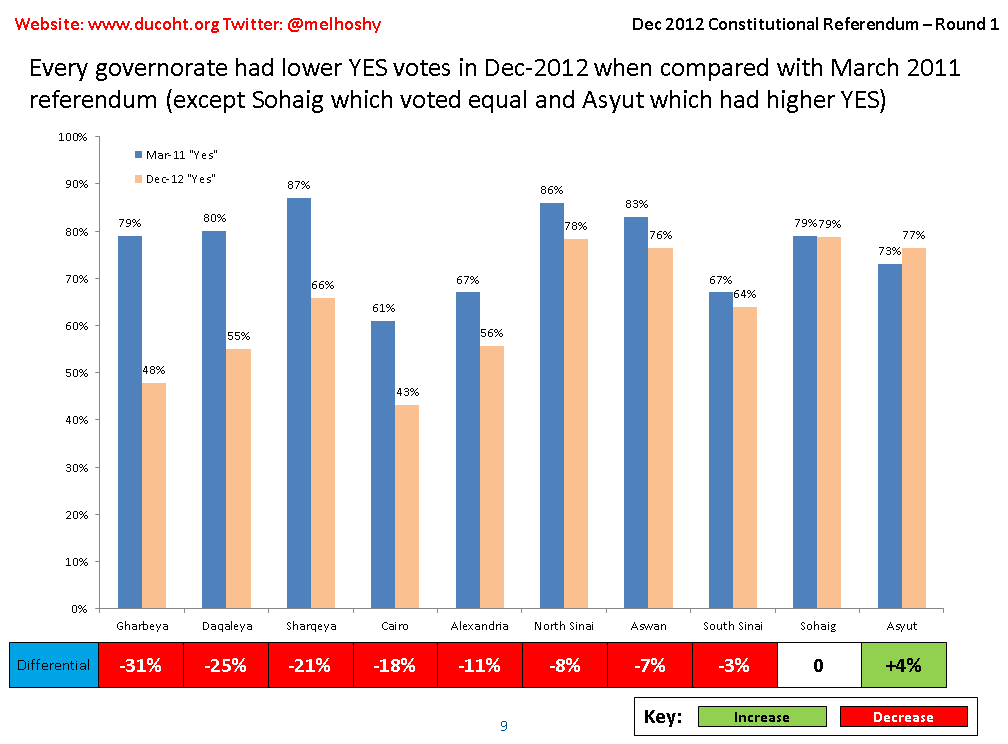
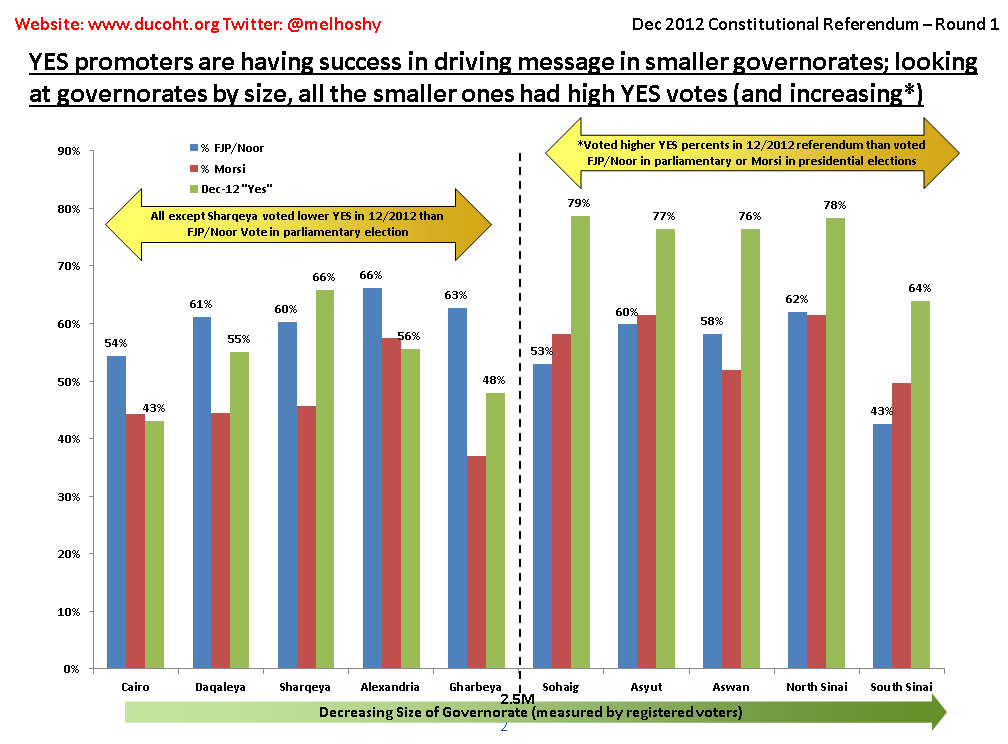
4. Detailed/underling data
Slide 8: The March 2011 referendum registered voter count is based on the parliamentary election data I found on the elections.eg website. I have not been able to find registered voters for the Mar-11 referendum, and have been told there isn't one but please let me know if you have it.

